
Last updated September 23, 2026
Insulation Warning Signs: A Buena Park Homeowner’s Reference Guide
A 15% month-over-month increase in cooling costs during a stable-weather period is a more reliable early warning sign than anything you can see from the attic hatch. Most insulation failures in Buena Park homes don’t announce themselves with visible mold or obvious drafts. They show up first as subtle shifts in utility patterns, surface temperatures that feel wrong under your hand, and HVAC systems that run longer to deliver less. This guide-and our broader Complete Guide to Insulation in Buena Park-teaches you to detect insulation problems at the evidence-gathering stage, before you’re staring at a $400 electric bill or a contractor who wants to sell you new insulation without proving the old stuff failed.
Quick Answer
The earliest insulation warning signs in a Buena Park home are utility bill spikes above 15% during stable weather, interior walls that feel noticeably warmer or cooler than ambient air, and HVAC runtimes that extend 20% or longer than the same month in prior years. Visual indicators like uneven snow melt on the roof, discolored ceiling patches near can lights, or compressed insulation in knee walls typically appear only after the thermal failure has progressed significantly. Document utility trends and surface temperature differentials first; they provide harder diagnostic evidence than visual inspection alone.
Table of Contents
- Utility Bill Patterns: The Earliest Warning System
- Tactile Checks: What Your Hand Can Detect
- Visual Inspection: What to Look For and What It Means
- HVAC Runtime and Performance Clues
- Three Failure Patterns Common in Buena Park Homes
- Thermal Imaging: Capabilities and Limitations
- The Documentation Protocol: Building Your Evidence File
- When to Call a Professional
Utility Bill Patterns: The Earliest Warning System
Your Southern California Edison bill is the most sensitive insulation diagnostic tool you already own. Most homeowners in Buena Park dismiss seasonal spikes as “just a hot month,” but weather-normalized data removes that excuse entirely.
The Orange County-specific resource is SCE’s EnergyManager portal, which provides degree-day-adjusted consumption graphs. Here’s how to use it diagnostically:
- Log into your SCE account and navigate to “My Energy Manager” under the Usage section.
- Select “Compare Bills” and set the view to “Weather Normalized” rather than raw usage.
- Compare the current month against the same month in the prior two years, not against the prior month.
- Flag any month where normalized kWh exceeds the prior-year same-month by 12% or more.
- Cross-reference with your own records: did occupancy change? Did you add a pool pump or EV charger? If not, the envelope is the suspect.
A Buena Park homeowner we worked with in the Los Coyotes Country Club area documented a 17% normalized increase in July 2023 versus July 2022. The weather data showed nearly identical cooling degree days. Their attic inspection revealed that blown-in fiberglass had settled 3 inches below the top plate, creating a thermal bypass that the blower-door test measured at 1,400 CFM50 of uncontrolled leakage. The fix wasn’t more insulation; it was air sealing the top plates and replenishing the settled material with GreenFiber cellulose to the proper depth.
The critical threshold: a 15% sustained increase during stable occupancy and weather-normalized conditions warrants investigation. A single anomalous month might be meter error or billing cycle length. Three consecutive months of elevated normalized usage means you’re paying to condition outdoor air.
Document the pattern before calling any contractor. A spreadsheet with date, billed kWh, weather-normalized kWh, and notes takes 10 minutes monthly and transforms you from a passive customer into a diagnostic partner.
Tactile Checks: What Your Hand Can Detect
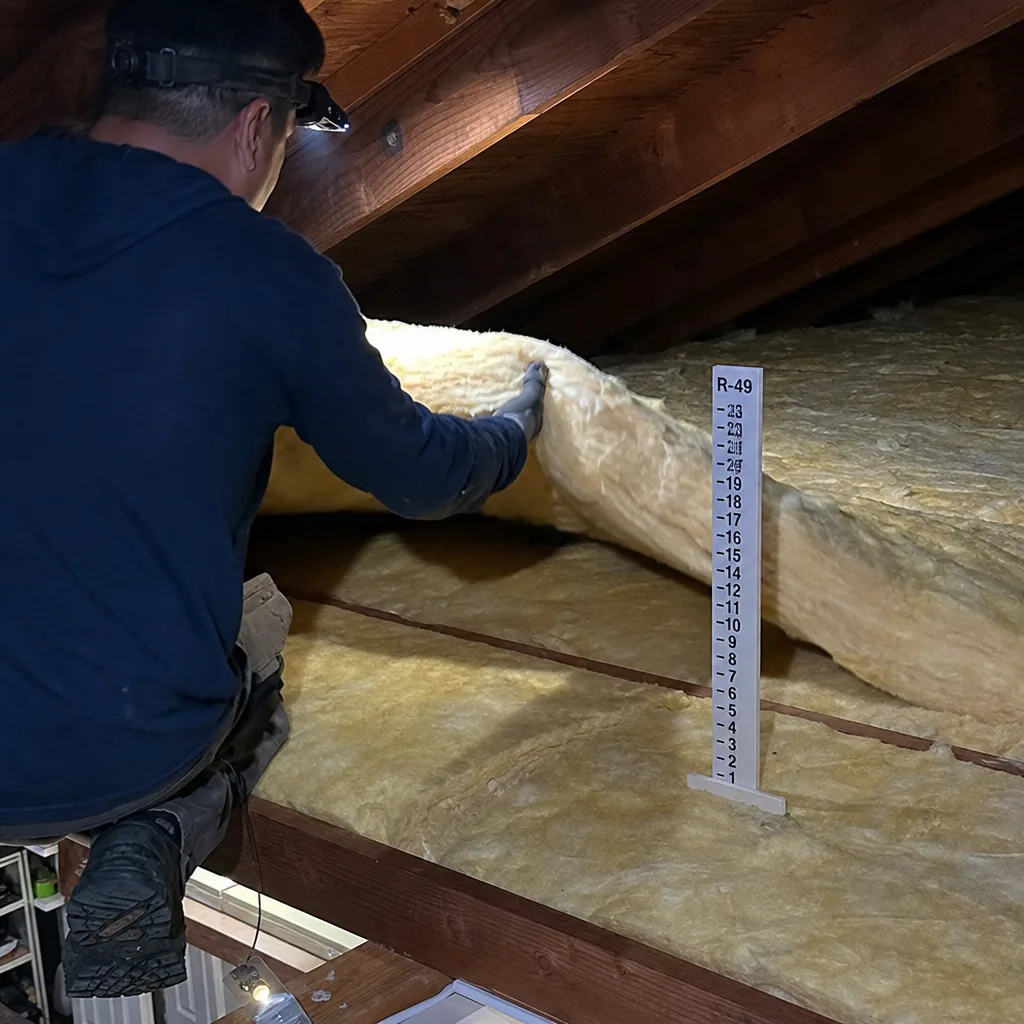
Surface temperature differentials reveal insulation gaps that visual inspection misses. Your palm detects temperature changes of 2°F or more, which corresponds to significant thermal bridging or missing insulation.
Perform these checks at consistent times: early evening, when the attic has heated through the day and the HVAC has been running for at least 30 minutes. Turn off ceiling fans so air movement doesn’t mask temperature variation.
- Interior wall surfaces: Place your palm flat against drywall on north-facing walls, then south-facing walls, then walls adjacent to the garage. A garage-adjacent wall that feels distinctly warmer in summer or cooler in winter indicates missing or degraded cavity insulation. In Buena Park’s climate, garage walls are particularly vulnerable because the unconditioned space reaches 110°F+ in August.
- Ceiling patches near fixtures: Feel around recessed can lights, bathroom exhaust fans, and smoke detectors. A 5°F or greater temperature spike within 6 inches of the fixture suggests a thermal bypass, where conditioned air leaks into the attic or the fixture itself lacks an airtight seal.
- Floor perimeters over crawl spaces: In homes with raised floors, the perimeter 12 inches near exterior walls often reads 8-10°F different from the room center. This indicates either missing subfloor insulation or failed crawl space vapor barriers allowing moisture to degrade what exists.
- Knee walls in bonus rooms: The vertical wall surface of a knee wall (the short wall under a sloped ceiling in a converted attic) should feel neutral. If it feels like exterior siding, the insulation behind it has likely fallen, compressed, or was never installed to full depth.
Record your findings with timestamps. “Garage-adjacent wall in bedroom 2, 6:15 PM, August 14, approximately 8°F warmer than opposite interior wall” is evidence a contractor can use. “That wall feels weird” is not.
For homeowners who want harder data, an inexpensive infrared thermometer ($30-50) quantifies what your hand suspects. Aim at the same spot from the same distance, and log the reading. But understand its limitation: it measures surface temperature, not air leakage rate. A cold spot might be missing insulation, or it might be a powerful air leak drawing conditioned air out. The distinction matters for the repair strategy.
Visual Inspection: What to Look For and What It Means
Visual inspection of insulation requires access that many homeowners don’t have, and the visible problems are usually advanced. Our Attic Insulation Maintenance Checklist for Buena Park Homeowners covers what to look for; still, certain observations from accessible areas provide useful confirmation.
Attic Inspection (From the Hatch)
Use a flashlight with fresh batteries. Look for these specific conditions:
- Settled blown-in material: Fiberglass and cellulose both settle over time, but uneven settlement creates thermal valleys. Look for areas where the insulation depth drops below the ceiling joist tops. In Buena Park, code-minimum attic insulation is R-38, which requires approximately 12 inches of fiberglass batts or 10-11 inches of blown cellulose. If you see pink or gray material well below the joist tops, it’s underperforming.
- Discoloration: Dark gray or black streaks on insulation surface indicate air filtration, where dust from the living space has been carried through gaps by moving air. This marks an air leak path, not just an insulation problem.
- Water staining: Yellow-brown stains on the attic side of drywall indicate past roof leaks that may have compressed or degraded insulation. Buena Park’s occasional heavy winter rains can create isolated wet spots that dry before the homeowner notices ceiling damage.
- Compressed batt insulation: Where storage boards or previous work have compressed fiberglass batts, the effective R-value drops proportionally. A batt compressed to half its designed thickness delivers roughly half the thermal resistance.
Exterior Observations
From the ground, look at your roof after a light frost or rare Buena Park snowfall:
- Uneven melt patterns: Areas where snow or frost melts faster indicate heat loss from below. This is most visible on north-facing slopes where solar gain doesn’t confound the reading.
- Icing at eaves: In rare cold snaps, ice dam formation at the gutter line indicates warm attic air melting snow that refreezes at the cold edge. This signals both insulation deficiency and ventilation imbalance.
Visual inspection confirms; it rarely diagnoses alone. The dark streak you see in the attic might be a minor air leak or a major bypass. The melt pattern on the roof might be insulation failure or a duct leak blowing 130°F air into the attic. Use visual findings to prioritize areas for professional assessment, not to self-diagnose the repair.
HVAC Runtime and Performance Clues
Your thermostat’s runtime data, or simply observing how long the system runs to maintain setpoint, provides envelope-performance information that complements utility bills.
Modern smart thermostats (Ecobee, Nest, Honeywell Home) log runtime hours. For older systems, manual logging works: note start and stop times during a typical afternoon. Compare against the same outdoor temperature conditions from prior years.
These patterns indicate insulation-related load increases:
- Extended afternoon run cycles: If your system runs 35-45 minutes per hour to maintain 78°F on a 92°F day, when it previously managed 20-25 minutes, the building is gaining heat faster. The likely culprits are attic insulation degradation, air leakage increase, or duct losses in unconditioned space.
- Inability to recover overnight: A system that can’t pull the house below 76°F by 10 PM after a hot Buena Park day, when it previously reached 74°F by 9 PM, suggests the thermal mass of the structure has absorbed more daytime heat. Poor attic insulation is the dominant cause in single-story homes; wall and attic together in two-story designs.
- Room-to-room temperature stratification: A 4°F or greater difference between the thermostat location and distant bedrooms, when the system has been running continuously for an hour, indicates either duct imbalance or envelope leakage in the warmer rooms. In Buena Park’s 1960s-1980s housing stock, this often traces to kneewall or garage-ceiling insulation failures.
One diagnostic note: extended runtimes with adequate cooling output suggest envelope load increase. Extended runtimes with weak airflow or warm supply air suggest mechanical failure. The distinction is whether the system is working hard and succeeding (insulation) or working hard and failing (HVAC).
If you have a smart thermostat, export the runtime data before calling a contractor. The correlation between outdoor temperature, runtime, and indoor setpoint over months tells a story that a single site visit cannot.
Three Failure Patterns Common in Buena Park Homes
Buena Park’s housing stock and climate create specific, repeatable insulation failure modes that differ from coastal Orange County or inland Riverside County. Our Seasonal Insulation Care for Buena Park: Year-Round Homeowner’s Guide covers how these patterns shift through the year; recognizing them helps you interpret your own observations.
1. Recessed Light Bypass Heating
Buena Park has thousands of homes built 1965-1985 with original non-IC (non-insulation-contact) recessed can lights. These fixtures were designed to vent heat into the attic, and they create direct thermal bypasses: conditioned air leaks around the housing, and attic air drops into the living space.
The warning sign is a ceiling that feels warm around can lights in summer, or dust accumulation on the trim ring that indicates air movement. The repair is air sealing with fire-rated covers, then insulating over them. We see this pattern repeatedly in the neighborhoods near Knott Avenue and the older sections of the city east of Beach Boulevard.
2. Garage-Adjacent Wall Thermal Bridging
Attached garages are common in Buena Park’s single-family stock. The shared wall is often framed with 2×4 studs at 16 inches on center, insulated with R-11 batts (original) or R-13 (later retrofits), and never air sealed. The garage reaches 115°F in August. The bedroom on the other side of that wall becomes the hottest room in the house.
The warning sign is the tactile check described earlier: that wall feels wrong. The repair requires dense-pack cellulose or spray foam insulation in Buena Park to fill the cavity completely and eliminate convection within the wall, plus air sealing at the top and bottom plates.
3. Compressed Knee-Wall Insulation in Split-Level and Bonus-Room Conversions
Buena Park’s 1970s split-levels and later second-story additions often have kneewalls, the short vertical walls under sloped ceilings. These are frequently insulated with batts that fall, get compressed by storage, or were installed with the vapor barrier on the wrong side in our cooling-dominant climate.
The warning sign is a bonus room or upstairs bedroom that’s 6-10°F different from the main floor. The repair involves re-insulating the kneewall with proper support, air sealing the kneewall-to-attic intersection, and often extending insulation along the sloped ceiling rafter bays. This is detailed work that affects the attic insulation in Buena Park performance directly.
Thermal Imaging: Capabilities and Limitations
Homeowner-grade thermal cameras, now available as smartphone attachments for $200-400, can visualize surface temperature differences that tactile checks only suggest. But the images require interpretation, and the cameras have genuine limitations that affect diagnostic reliability.
What thermal imaging shows: Surface temperature variation across walls, ceilings, and floors. A 10°F gradient across a ceiling clearly marks a problem area. Time-lapse imaging (same location, morning and evening) can distinguish thermal mass effects from active air leakage.
What it does not show:
- Air leakage rate: A cold spot might be conductive loss through missing insulation, or it might be 200 CFM of conditioned air escaping. The thermal image looks similar; the repair strategy differs significantly.
- Insulation depth: You cannot determine whether attic insulation is R-19 or R-38 from a thermal image of the ceiling below. You only see the surface temperature result.
- Moisture content: Wet insulation conducts heat differently, but thermal cameras cannot distinguish wet insulation from properly installed dense-pack cellulose without a moisture meter.
- Air movement within assemblies: Wind washing, where attic ventilation air moves through loose insulation and degrades its performance, is invisible to thermal imaging until the degradation is severe.
The calibrated blower-door test resolves these ambiguities. It pressurizes the house to 50 Pascals below atmospheric pressure and measures the airflow required to maintain that difference, in CFM50. A single number summarizes whole-envelope leakage. When combined with thermal imaging during the test (the “blower-door-guided infrared” technique), you can watch leakage paths activate in real time.
At Envelope Insulation Co., we publish before-and-after blower-door numbers on every applicable job. A typical Buena Park home of 1,600 square feet might test at 3,500 CFM50 before work and 2,100 CFM50 after comprehensive air sealing and insulation. The homeowner receives this documentation; it’s not internal data we keep to ourselves.
If you purchase a thermal camera for self-diagnosis, use it to generate questions, not answers. The image that shows a 15°F ceiling gradient tells you where to point a contractor’s attention. It does not tell you whether the fix is more insulation, better insulation, air sealing, or duct repair.
The Documentation Protocol: Building Your Evidence File
The most effective diagnostic calls we receive come from homeowners who have documented their observations systematically. The evidence file transforms a vague complaint into a solvable problem and protects you from contractors who want to sell before they assess.
Build your file in this sequence:
- Utility data export: Download 24 months of SCE bills. Calculate the weather-normalized usage trend. Highlight the month when the increase began.
- Tactile check log: Create a simple table: Location / Date & Time / Hand Temperature Estimate / Infrared Thermometer Reading (if available) / Notes. Cover all rooms, all exterior walls, ceiling near fixtures, and floor perimeters.
- Photographic record: Photograph the attic from the hatch, any visible insulation conditions, exterior melt patterns, and thermostat runtime screens. Include a timestamp and note the outdoor temperature.
- HVAC runtime log: For one week, note the system’s on/off cycles during the hottest afternoon period. Record outdoor temperature, indoor setpoint, and total runtime per hour.
- Occupancy and change notes: Document any changes that might affect load: new appliances, window replacements, occupancy changes, thermostat adjustments. This prevents false correlations.
Organize these in a single digital folder. When you contact a contractor, send the utility trend and one representative photo in your initial message. A contractor who responds with specific questions about your data is likely conducting genuine diagnostics. A contractor who ignores your evidence and pushes for an immediate “free inspection” is likely conducting a sales process.
Under Haven Standard: Have it in writing. Any contractor who visits should provide a written scope, written price, and written warranty before proposing work. Your documentation file gives you the standing to demand this; you have already done the preliminary engineering.
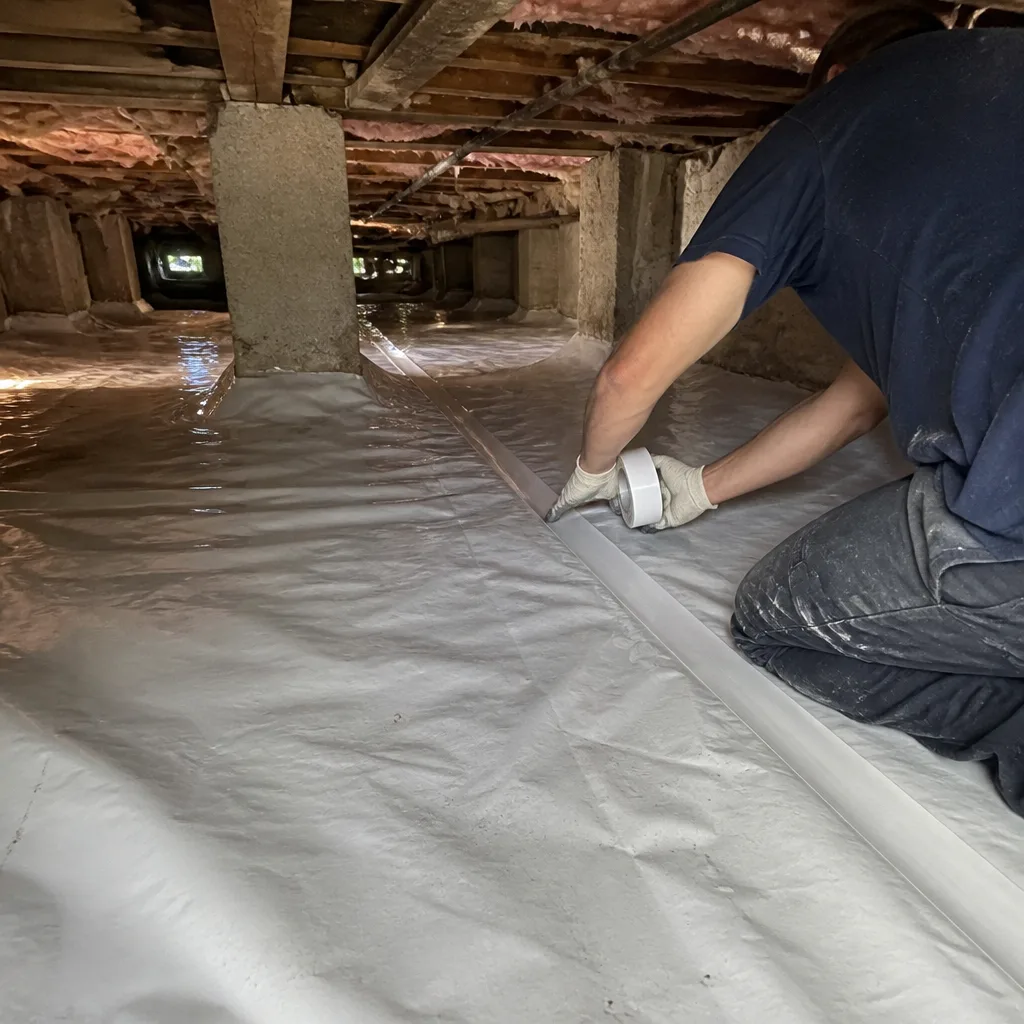
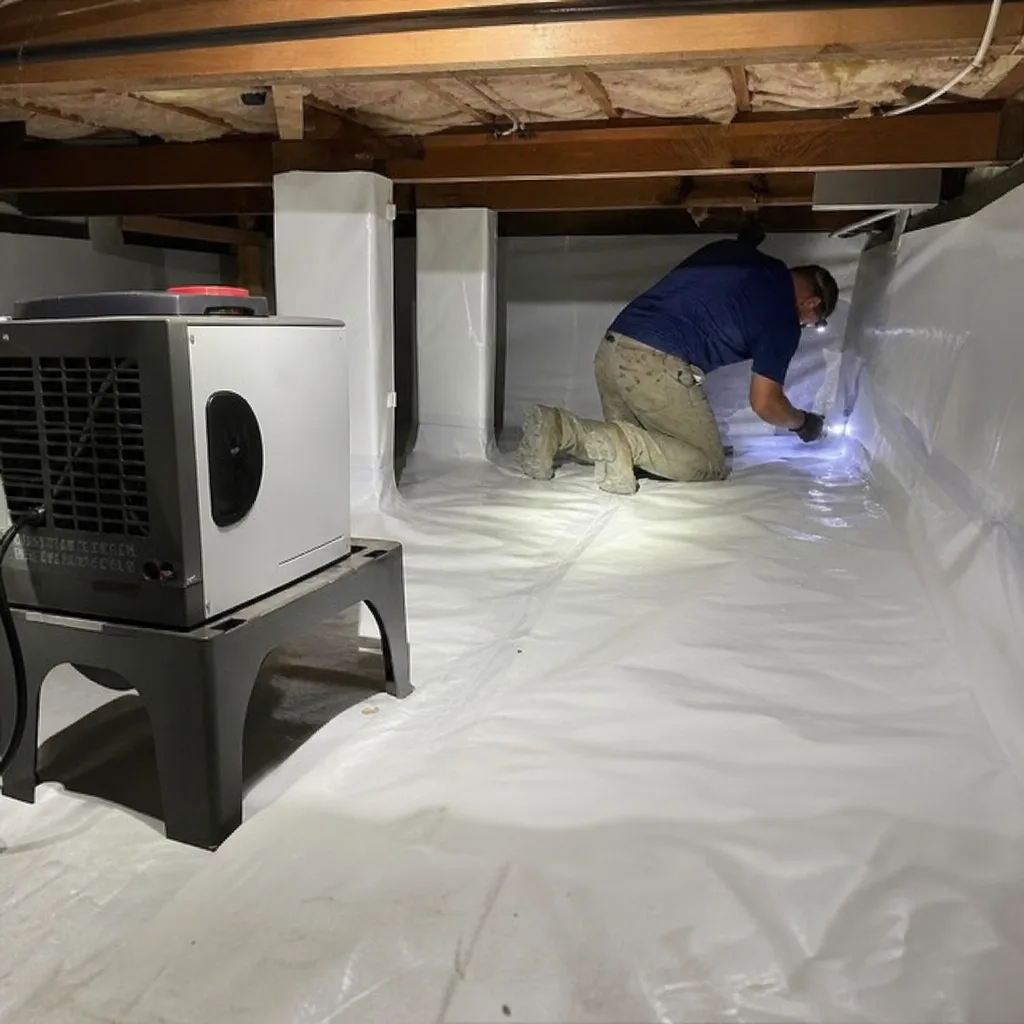
For homes with crawl space concerns, extend your documentation to include moisture readings and vapor barrier condition. Crawl space encapsulation and vapor barrier in Buena Park addresses the moisture-driven degradation that ruins subfloor insulation in our climate.
Common Mistakes to Avoid
- Adding insulation over unsealed air leaks: Blown fiberglass over a leaky attic floor simply filters the escaping air. The insulation becomes a dirty gray indicator of the leak path, not a solution. Air sealing must precede insulation, always.
- Trusting visual depth alone: Insulation that looks thick may be fluffed, moisture-compacted, or installed with gaps. The thermal performance depends on continuous contact with the air barrier, not just apparent volume.
- Ignoring the garage ceiling: In Buena Park’s climate, the garage ceiling is often the most thermally stressed plane in the house. It sees 115°F above and 75°F below, with minimal insulation originally installed. Room temperature problems above or beside the garage often trace here.
- Using “just add more” as the default strategy: In many cases, existing insulation has degraded or been displaced rather than simply proving inadequate. A full removal and replacement with proper air sealing sometimes outperforms additional layers over compromised material.
- Neglecting to verify post-work performance: Without a blower-door test or thermal verification, you have no evidence the work achieved its goal. Demand documentation; it’s the only proof that matches your payment.
- Assuming all contractors sequence work correctly: The majority of insulation contractors in Orange County will add insulation without air sealing first, because it’s faster and requires less skilled labor. Ask specifically about sequencing, and get it in the written scope.
When to Call a Professional
Call for assessment when your documentation shows three consecutive months of weather-normalized usage increase, when tactile checks reveal 8°F or greater surface temperature differentials, or when any room consistently runs 5°F or more from the thermostat setpoint despite extended HVAC runtime.
Also call before the problem advances: water stains on the ceiling, visible mold on attic sheathing, or insulation that has been disturbed by rodents. These conditions compound quickly in Buena Park’s warm climate, and the repair scope grows with delay.
Topside Attic Insulation Buena Park home offers free estimates in Buena Park. We’ll review your documentation with you, conduct a blower-door test if indicated, and provide a written scope and price before any work is proposed. Call (562) 418-5767 to schedule.
Frequently Asked Questions
Most attic air sealing and insulation replacement jobs in Buena Park run between $2,800 and $6,500 for homes between 1,200 and 2,400 square feet, depending on access conditions, existing material removal requirements, and whether spray foam or blown cellulose is specified. Wall insulation work, particularly garage-adjacent walls or kneewalls, typically adds $800 to $2,200 per wall assembly. We provide a written price before any work starts, and we offer a free second opinion on any competing written estimate. Call (562) 418-5767 for an exact quote on your specific conditions.
You can, but you shouldn’t if the existing material is compromised or if air leaks remain unsealed. Adding new fiberglass over settled, dirty, or moisture-affected insulation traps the problem and often reduces overall performance. The correct sequence is air seal first, assess existing insulation condition, then add or replace material as the written scope specifies. In our experience across 9,000+ homes, the homes that perform best long-term are those where we removed compromised material, sealed the envelope, and installed fresh insulation to a documented depth.
Isolate the variables using SCE’s weather-normalized data. If normalized usage is up 15% or more and your HVAC runtime has increased proportionally, the building envelope is the prime suspect. If runtime is normal but the system produces weak cooling, suspect mechanical failure. If usage is up but runtime is normal, suspect an appliance or water heater issue. Your documentation file, particularly the correlation between outdoor temperature and consumption, points the finger accurately.
Air sealing stops conditioned air from escaping and unconditioned air from entering, using caulk, foam, and gasket materials at gaps and penetrations. Insulation slows conductive heat transfer through building assemblies. They address different physical mechanisms and both are required for performance. A house with excellent insulation but leaky construction performs poorly; a house with excellent air sealing but no insulation also performs poorly. We seal first, then insulate, in that order, on every job.
Orange County and the city of Buena Park follow the California Energy Code (Title 24), which specifies minimum R-values for new construction and major renovations: R-38 for attics in climate zone 8, where Buena Park is located. Existing homes are not required to upgrade to current code unless the conditioned space is significantly altered, but performance-minded homeowners often exceed minimums. Permits are required for certain types of spray foam application and for any work involving structural modification. We handle permit requirements as part of our written scope when applicable.
Typical attic air sealing and insulation replacement in a Buena Park home of 1,500-2,000 square feet requires one to two days. You receive a written scope before work begins, a Documented Photo Record of conditions found and work completed, and on applicable jobs, before-and-after blower-door readings showing the measured air leakage reduction. For more guides & resources on protecting your investment, visit our blog. The 365-Day Done Right Promise applies to all completed work, with the written warranty delivered before the crew departs.
The Bottom Line
Insulation failure in Buena Park announces itself first through utility data and tactile evidence, not through visible deterioration. The homeowner who documents weather-normalized consumption trends, performs systematic surface temperature checks, and maintains a photographic record arrives at the contractor conversation with diagnostic leverage. The most common local failure patterns, recessed light bypasses, garage-adjacent thermal bridging, and kneewall compression, are all addressable with proper air sealing followed by appropriate insulation. Demand written scope, written price, and written performance verification. The documentation you keep protects the investment you make.
Written by Wes Okafor, Owner at Topside Attic Insulation Buena Park, serving Buena Park since 2016.